Markets Summary:
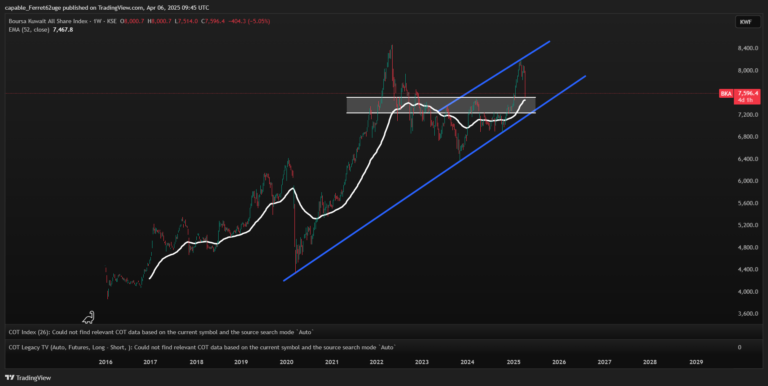
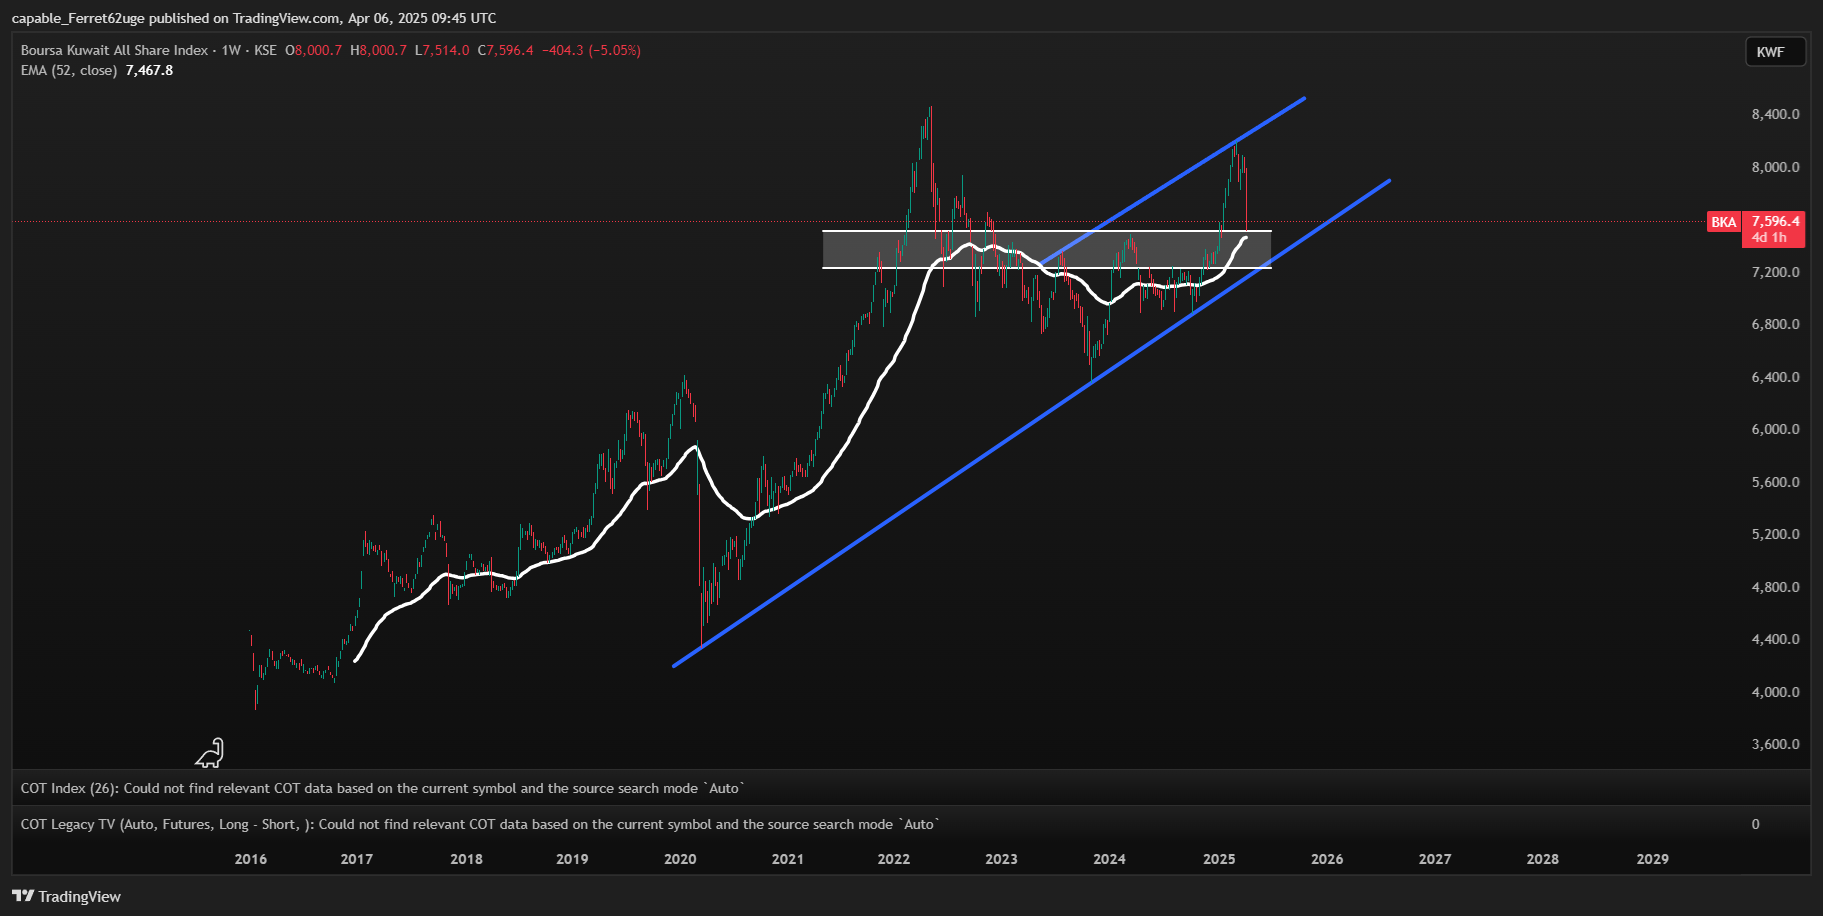
Kuwait All Shares Index: Correction in progress

The chart shows a correction phase in the market where the index struggles to break the resistance at around 8,200. Although the market has been in an uptrend, the inability to surpass the previous high at 8,200 signals that the market may be in a temporary consolidation or correction phase. The moving averages are still indicating bullish momentum, but we need further confirmation before calling for a full reversal.
Nikkei 225 – Head & Shoulders Pattern Confirmed

“The Nikkei 225 index has confirmed a reversal pattern known as ‘Head & Shoulders’ (H&S), signaling a potential downtrend. We expect this to be a sharp drop, and as a result, a short position has been opened. The trend is expected to continue unless further confirmation suggests otherwise.”
Nasdaq 100- Bearish Reversal with Technical Confirmation”

“The Nasdaq 100 index is reversing from its previous bullish trend and is turning downward. This reversal is confirmed by three key technical signals:
- The formation of a double-top pattern at the highs.
These signs suggest a potential downtrend unless proven otherwise. - A break of the main ascending channel
- A violation of the 52 and 200 moving averages
E-Mini Dow Jones: Double Top

Dow Jones forms a double-top pattern and fails to continue its upward trend after breaching the 45,250 level. The overall trend is now bearish.
Russell 2000 is already into the reversal- Trending Down

The Russell 2000 breaks its rising trend and forms three consecutive lower tops – signaling weakening momentum, showing clear down trend.